| Development of a basis for 3D Surface Roughness Standards | SurfStand |
14 (+3) Parameters for 3D Surface
Roughness
This page includes fourteen parameters based on the project BRC No:
3374/1/0/170/90/2 and three new “volume” family parameters.
AMPLITUDE PARAMETERS
Four parameters are used for characterizing the amplitude property of surfaces. They are classified into four categories, i.e. (i) dispersion, (ii) extreme, (iii) asymmetry of the height distribution and (iv) sharpness of the height distribution.
(1). Root-Mean-Square Deviation of the Surface Sq
This is a dispersion parameter defined as the root mean square value
of the surface departures within the sampling area.
![]() ( 1 )
( 1 )
where, M is a number of points of per profile, N is the number of profile. Sq is a very general and widely used parameter. In statistics, it is the sample standard deviation.
(2) Ten Point Height of the Surface Sz
This is an extreme parameter defined as the average value of the absolute
heights of the five highest peaks and the depths of the five deepest pits
or valleys within the sampling area.
 ( 2 )
( 2 )
where ![]() and
and ![]() are the five highest surface summits and lowest surface valleys respectively,
which rely on eight nearest neighbour summits.
are the five highest surface summits and lowest surface valleys respectively,
which rely on eight nearest neighbour summits.
(3) Skewness of Topography Height Distribution Ssk
This is the measure of asymmetry of surface deviations about the mean
plane.
![]() ( 3 )
( 3 )
This parameter can effectively be used to describe the shape of the topography height distribution. For a Gaussian surface which has a symmetrical shape for the surface height distribution, the skewness is zero. For an asymmetric distribution of surface heights, the skewness may be negative if the distribution has a longer tail at the lower side of the mean plane or positive if the distribution has a longer tail at the upper side of the mean plane. This parameter can give some indication of the existence of "spiky" features.
(4) Kurtosis of Topography Height Distribution Sku
This is a measure of the peakedness or sharpness of the surface height
distribution.
![]() ( 4 )
( 4 )
This parameter characterizes the spread of the height distribution.
A Gaussian surface has a kurtosis value of 3. A centrally distributed
surface has a kurtosis value larger than 3 whereas the kurtosis of a well
spread distribution is smaller than 3. By a combination of the skewness
and the kurtosis, it may be possible to identify surfaces which have a
relatively flat top and deep valleys.
SPATIAL PARAMETERS
Four parameters are used to characterize spatial properties, density of summits, texture aspect ratio, directionality of surface lay and Fastest decay autocorrelation length.
(1). Density of Summits of the Surface Sds
This is the number of summits of a unit sampling area, which relies
on the eight nearest neighbour summit definition. I.e. a peak is defined
of it is higher than its 8 nearest neighboures.
![]() ( 5 )
( 5 )
(2). Texture Aspect Ratio of the Surface Str
This is a parameter used to identify texture strength i.e. uniformity
of texture aspect. It is defined by Areal autocorrelation function
(AACF). Str can be defined as its ratio of the fastest to slower
decay to correlation length, 0.2, of the AACF function.
 ( 6 )
( 6 )
where

In principle, the texture aspect ratio has a value between 0 and 1. Larger values, say Str>0.5, of the ratio indicates uniform texture in all directions i.e. no defined lay, Smaller values, say Str<0.3, indicates an increasingly strong directional structure or lay. Since the size of the sampling area is finite, it is possible that the slowest decay of the AACFs of some anisotropic surfaces never reaches 0.2 within the sampling area. In this case the longest distance of the AACF along the slowest decay direction can be used instead.
(3). The Fastest Decay Autocorrelation Length Sal
This is a parameter in length dimension used to describe the autocorrelation
character of the AACF. It is defined as the horizontal distance of
the AACF which has the fastest decay to 0.2. In other words the Sal is
the shortest autocorrelation length that the AACF decays to 0.2 in any
possible direction.
![]() ( 7 )
( 7 )
For an anisotropic surface Sal is in a direction perpendicular to the surface lay. A large value of Sal denotes that the surface is dominated by low frequency (or long wavelength) components. While a small value of the Sal denotes the opposite situation.
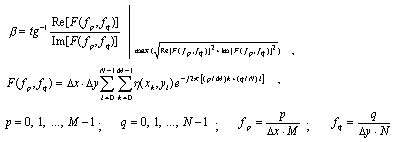
(4). Texture Direction of the Surface Std
This is the parameter used to determine the most pronounced direction
of the surface texture with respect to the y axes within the frequency
domain, i.e. it gives the lay direction of the surface. A unified
definition of the texture direction of a surface is given an angle.
By this definition, when the measurement trace direction is perpendicular
to the lay (this is a very common case) the texture direction is ![]() .
.
 ( 8 )
( 8 )
where, ![]() is
the position where the maximum value of the angular spectrum.
is
the position where the maximum value of the angular spectrum.

HYBRID PARAMETERS
The hybrid property is a combination of both amplitude and spacing. Any changes that occur in either amplitude or spacing may have an effect on the hybrid property. Three hybrid parameters are calculated here.
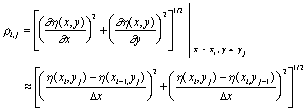
(1). Root-Mean-Square Slope of the Surface ![]()
This is the root-mean-square value of the surface slope within the
sampling area.
![]() ( 9 )
( 9 )
Where

(2). Arithmetic Mean Summit Curvature of the Surface Ssc
This is defined as the average of the principal curvatures of the summits
within the sampling area. Since the sum of the curvatures of a surface
at a point along any two orthogonal directions is equal to the sum of the
principal curvatures.
 ( 10 )
This parameter can only be calculated after the summits.
(3). Developed Interfacial Area Ratio Sdr
This is the ratio of the increment of the interfacial area of a surface
over the sampling area.
 ( 11 )
Where the interfacial area of the quadrilateral is

The developed interfacial area ratio reflects the hybrid property of
surfaces. A large value of the parameter indicates the significance of
either the amplitude or the spacing or both.
FUNCTIONAL PARAMETERS
INDEX FAMILY
The functional indexes proposed here are applicable to all kinds of
typical engineering surfaces (highly stressed or ordinary).
(1) Surface Bearing Index Sbi
This is the ratio of the RMS deviation over the surface height at 5%
bearing area.
![]() ( 12 )
( 12 )
where ![]() is
normalised the surface height at 5% bearing area. A larger surface
bearing index indicates a good bearing property.
is
normalised the surface height at 5% bearing area. A larger surface
bearing index indicates a good bearing property.
(2). Core Fluid Retention Index Sci
This is the ratio of the void volume of the unit sampling area at the
core zone (5% ~ 80% bearing area) over the RMS deviation.
![]() ( 13 )
( 13 )
A larger Sci indicates a good fluid retention. For a Gaussian surface, this index is about 1.56.
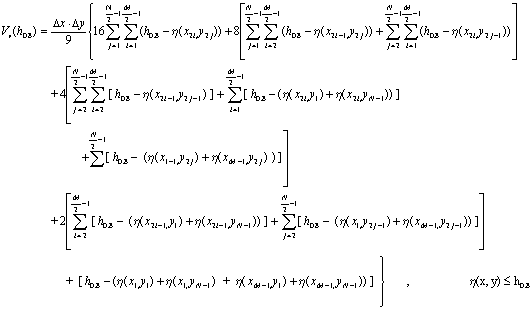
(3). Valley Fluid Retention Index Svi
This is the ratio of the void volume of the unit sampling area at the
valley zone (80% ~ 100%) over the RMS deviation.
![]() ( 14 )
( 14 )
Where

A larger Svi indicates a good fluid retention in the valley zone.
VOLUME FAMILY
The material volume and void volume in the surface bearing area is
a naturally geometrical descriptor of a surface topography. The material
volume and void volume enclosed in the contacting surface of the material,
they may have a very close relation with functional properties of the surface,
such as bearing, wear, running in and fluid retention. Three volume parameters,
are presented here to characterize the functional properties of surfaces.
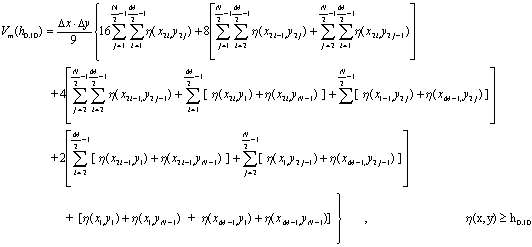
(1). Materiel Volume of the Surface Sm
Firstly, the material volume is defined as the material portion enclosed
in the 10% bearing area and normalised to unity.
![]() ( 15 )
( 15 )
where

The material volume and the material volume ratio are not only geometrical descriptors of the surface, but also have significant functional implications. The material volume may reflect wear and the running-in properties. On the other hand, for a "flat-topped" surface, such as a honed surface, the material volume ratio may increase quickly, whereas for a spiked surface, such as a bored surface, the function shows a slow increase with the truncation level. Thus functionally, the material volume reflects the resistance against wear and friction. Surfaces with a rapid increase in the material volume ratio show good running-in properties whereas those with a slow increase of the functions indicates that the top part of the material is easily worn.
(2). Core Void Volume of the Surface Sc
A core void volume is enclosed from10% to 80% of surface bearing area
and normalised to the unit sampling area.
![]() ( 16 )
( 16 )
(3). Valley Void Volume of the Surface Sv
The valley void volume of the unit sampling area is defined as a void
volume at the valley zone from 80% to 100% surface bearing area.
![]() ( 17 )
( 17 )
The void volumes is proposed here to provide a direct inspection of
lubrication and fluid retention of surfaces. It represents the fluid
retention ability of a highly wear surface. For a flat topped surface,
such as a honed surface, the core void volume may decrease quickly with
the truncation level, whereas for a spiked surface, such as a bored surface,
the function shows a slow decrease. Thus functionally, the void volumes
reflect the fluid retention property.
Copyright/Source: Centre
for Ultra Precision Technologies
University
of Huddersfield, Queensgate, Huddersfield, HD1 3DH, U.K.