

 MatSE 443
 Introduction to the Materials Science of Polymers
Penn State University
 PC Painter and MM Coleman Fundamentals of Polymer Science (2nd Edition, CRC Press) |
Chapter 11
Concepts that you must know:
- Understand the concepts of stress, strain, modulus and viscosity and have a broad feel for the strength, stiffness and toughness of polymers relative to other materials.
- Sketch the form of the stress-strain plots obtained from various general classes of polymers (elastomers, glassy polymers, semi-crystalline polymers, etc.).
- Appreciate how variations in temperature and/or the introduction of plasticizers can affect the shape of the stress-strain plot.
- Understand the definitions of the following materials properties: strength, toughness, modulus, and enlongation-at-break and know how to estimate from the stress-strain graph
- Understand yielding phenomena in polymers.
- Describe the basic properties of polymer melts, the concept of entanglement, reptation, and the dependence melt viscosity on molecular weight
- Understand the nature of viscoelasticity, particularly creep and stress relaxation
- Describe the time-temperature superposition principle and the WLF equation.
- *Go through the material that describe the following two graphs:
and make sure you can identify the various regions (A-D), understand how to derive properties (e.g. modulus, strength, Tg or Tm, etc) from such graphs
The interactive module below is an Adobe Flash object (whose native support is deprecated); you will need a Flash Emulator extension for your browser: there are several available for free in your browser's extension/web store (we recommend the "Ruffle Flash Emulator" extension, also "Flash Player Emulator 2024", "Flash works Again" and "Flash Player Enabler" seem to be as good for this course's interactive modules).
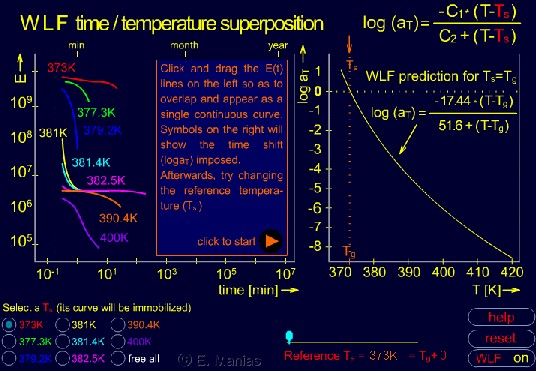
- After reading the help window, close it. Move the curves of the left panel towards the right (the first -red- one is immobilized) until they appear to overlap into a continuous curve. Notice the shift factors -right panel- while you move each curve. Click the "WLF on" button to see how well you shifted each curve. Comment on the log(a_T) shift factors and the amount of time you displaced each curve.
- *Move the reference temperature slider and comment on the time scale movements. Also comment on what short of timescales of experiments are needed o measure the whole curve at this reference temperature.
- Hit the "help" button to reveal at what temperatures each curve was measured. Close the help window, pick another Ts from the temperatures in the bottom left side. Repeat all the curve shifting, and comment on the shift factors. What do positive vs. negative values of the log(a_T) mean ?